The Market Cycles that Matter
Market timing may be difficult but key economic cycles can offer clues. A rare cycle signal now points to a possible market peak and a period that calls for caution.


Conventional wisdom suggests that timing the market is impossible. Many academics and pundits make this claim—often without truly doing their homework.
To be fair, much of what investors rely on simply doesn’t work. Reacting to headlines, following broad economic trends, or selling only after the market has already declined by 20%—none of these strategies offer much value.
Why? Because they are all backward-looking, responding to what has already happened.
As the saying goes, “The trend is your friend until it bends or ends.” I’ve found that market cycles can sometimes indicate when a trend is about to shift or conclude. Not always, but often enough to be worth paying attention to.
Not All Cycles Are Created Equal
Through my research, I’ve found that some market cycles are far more reliable than others. While the lunar cycle has been linked to emergency room visits and commodity price movements, it has little value in predicting stock market trends. Similarly, the four-year election cycle makes for a compelling narrative but ranks only 25th in statistical significance (based on data since 2000).
So, which cycle matters most?
The 181-Week Kitchin Cycle
Originally discovered in the 1920s, the 181-week Kitchin cycle describes economic fluctuations driven by inventory build-ups and liquidations. A century later, it remains one of the most relevant market cycles.
In the chart below, this cycle is represented in pink, while the S&P 500 index appears in blue.
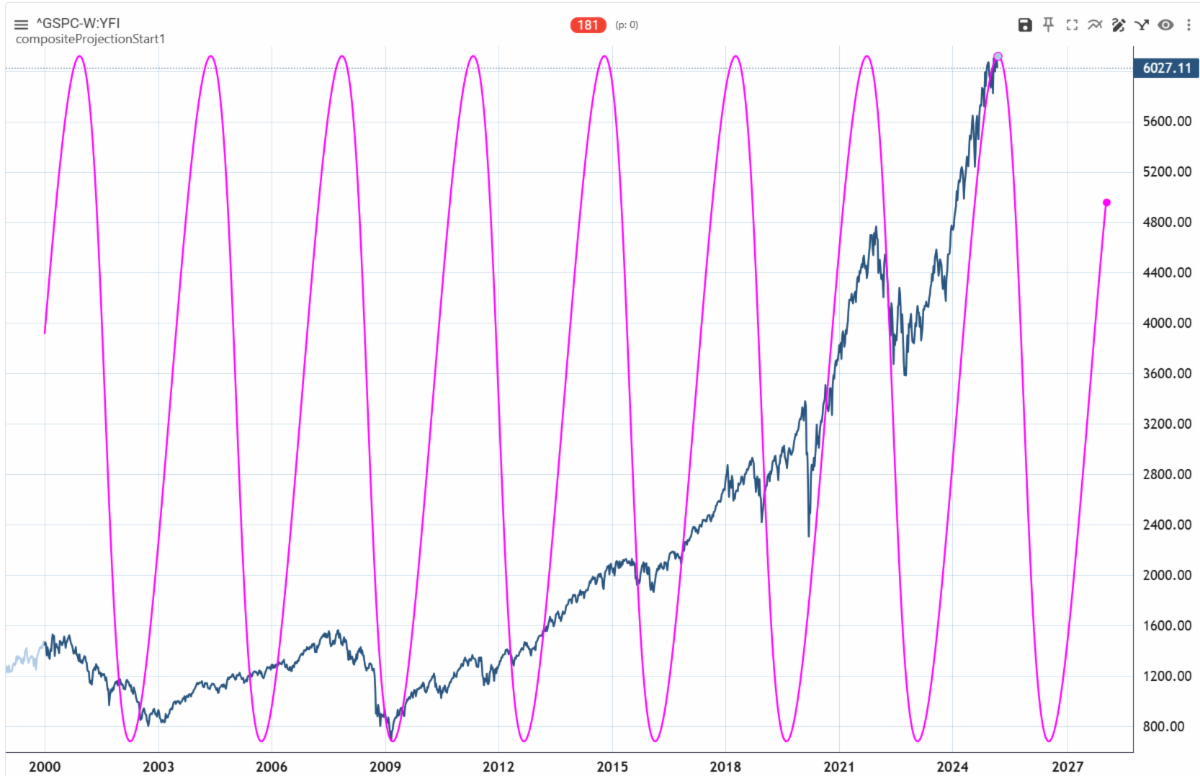
Earlier this week, the Kitchin cycle generated a rare sell signal. In response, we have been reducing risk exposure across our portfolios. In our aggressive growth stock accounts, we’ve been raising cash. In our ETF portfolios, we’ve reallocated some funds from stocks to bonds.
A More Detailed Forecast
When we combine the 181-week Kitchin cycle with two other key cycles—the 351-week Juglar cycle (which tracks capital investment) and the 24-week intermediate cycle—we gain a more refined predictive model.
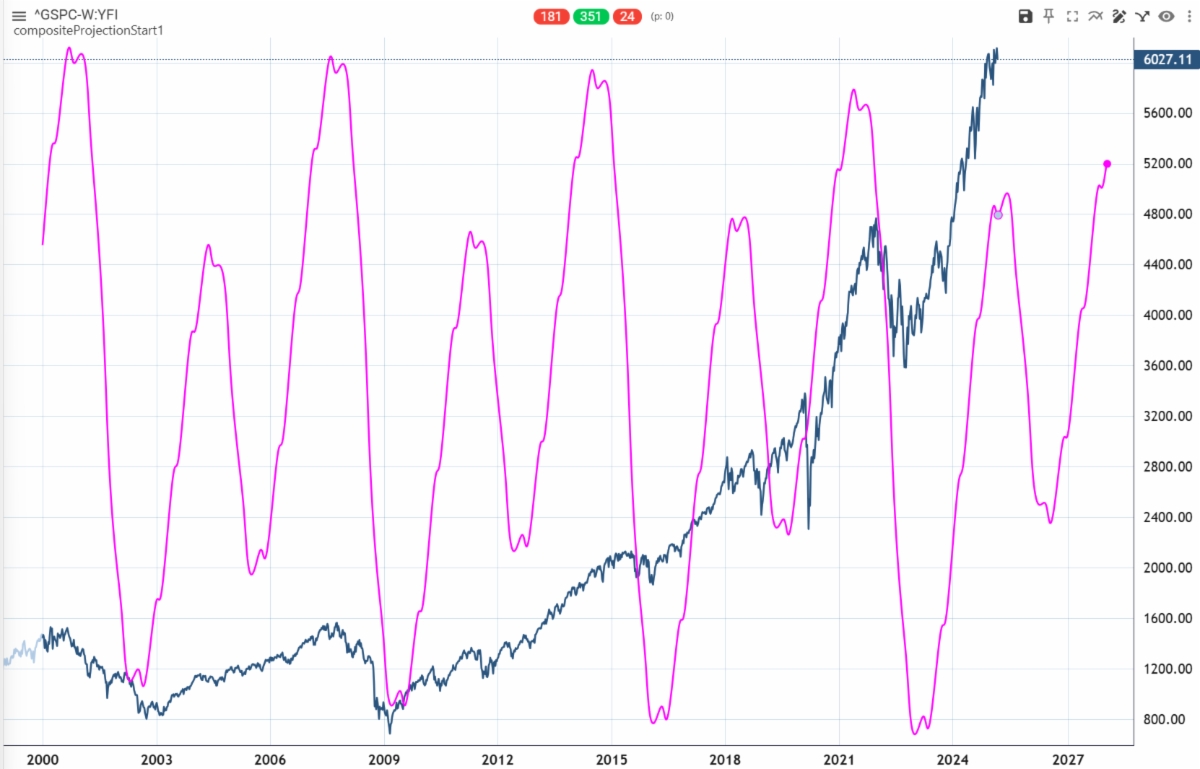
These additional cycles temporarily offset the downward effects of the Kitchin cycle until May. After that, all three cycles align in a way that suggests market weakness.
This gives us a likely window for peak stock prices between now and late spring.
While cycles are never absolute, they provide a useful framework for anticipating market shifts—and right now, they suggest that caution is warranted.
Copyright ©️ 2026. All Rights Reserved.
About the author

Disclosure
Information contained herein is for educational purposes only and is not to be considered a recommendation to buy or sell any security or investment advice. Securities listed herein are for illustrative purposes only and are not to be considered a recommendation. The author and StratFI clients may hold positions in securities mentioned.
Do you want monthly
Foresight straight to your inbox?
Straightforward commentary, strategic perspectives, and no noise — just one email a month to help you think smarter about your financial future.
Related articles
Explore timely insights and thoughtful perspectives from James Lee and StratFI. Each article is designed to help you cut through the noise, understand the bigger picture, and invest with confidence.


Straightforward commentary, strategic perspectives, and no noise, just one email a month to help you think smarter about your financial future.