Getting Realistic About Trends & Cycles
There is something irresistible about doing things that people say can't be done. Like trying to beat index funds, or timing the market.
With interest rates coming off all-time lows, bonds are looking less and less attractive for diversification. Real estate is also at risk, particularly if Trump's tax reform plans go through. Meanwhile, stocks have been the "best game in town" for a long, long time. This bull market has been going on since March of 2009 and is the second-longest on record.
Clients are happy with their recent gains, but are beginning to ask me "how long can this go on?"
There are two basic tools of technical analysis - trends and cycles. Trends tell you how things are going. There is no reason to fight against a good trend if you don't need to.
One of my favorite trend-following indicators is the 20 & 30 week exponential moving average crossover. This effectively warned investors of both the 2001 and 2009 bear markets. As a long-term indicator, it doesn't raise a flag very frequently, so when it does, caution is warranted. Note that this method also indicated bear markets which didn't occur in 2011 and 2015 (both false positives). No major sell signals since then.
At this point, the big trend is still very much on the side of investors.
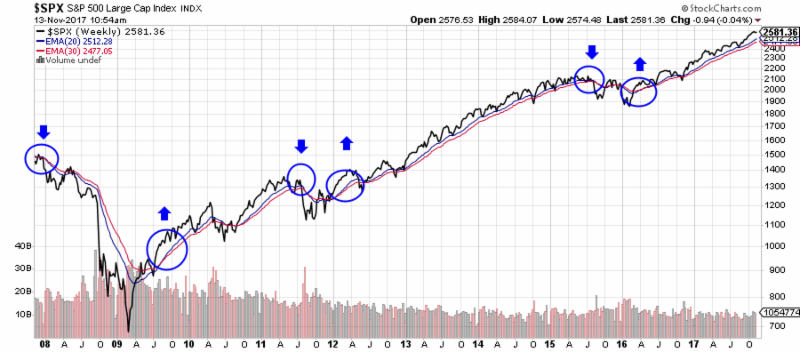
Past performance not indicative of future results
The problem with following trends that they only identify market tops after the fact. Markets don't ring a bell at the top, and trend-following tools won't alert you until after a pullback has already started.
This brings us to the second major tool for technical analysis. Cycles can sometimes help investors "see around corners" by identifying turning points before they happen.
Cycles are patterns that are persistent and (sometimes) predictive. Almost all market gains over the past 30 years have been made between the months of November and May. Summers are mostly forgettable. Meanwhile, the best times to be invested in stocks are typically the very beginning and the middle of each month. These periods coincide with the timing of contributions to corporate 401k plans.
At StratFI, we've built a trading algorithm that seeks to capture these seasonal effects and more. The unleveraged (decaffeinated) version has generated live performance returns in the 11% range year-to-date, while the 2x leveraged (caffeinated) model is up 23%. Both are invested in the S&P 500 index less than 40% of the time. Sounds great, doesn't it?
This a good tactical strategy, but it doesn't always forecast big moves in the market. For that, we need to look at longer-term cycles.
Here's a breakdown of the cycles identified by Jay Kaeppel, Yale Hirsh, Norman Fosback, Peter Eliades, and other market timing gurus:
10 Year Decennial Cycle
4 Year Presidential Election Cycle
212 Week Cycle
Seasonal/Calendrical Cycles
40 Week Cycle
Each of these cycles can be used to mitigate risk on a stand-alone basis. We have a reasonably good understanding for three of the cycles, but for two (the 40 and 212 week cycles), we can't offer any explanation for why they work. They just do.
Correlation isn't the same as causation, so some skepticism is warranted.
When we add these cycles together (and weight them for influence), we can get a picture of potential turning points for stocks over the next 15 years.
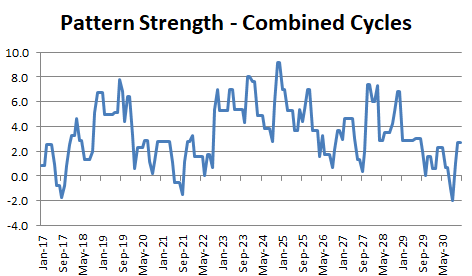
Source: StratFI
What This Suggests
Estimating market turning points years ahead of time is very difficult to do. Any typical forecast needs to be taken with "a grain of salt." This might require a pound or more.
1) At the end of this month (November), we are coming out of what was a potentially higher risk period for the market. With all the negativity in the media and political uncertainty, markets could have broken down, but didn't.
2) According to the cycles, 2018-2019 actually look pretty good. Demographic data of Millennials and household formation seem to support this. Note that there could be seasonal weakness June-September next year.
3) 2020-2021 appears to be the next major window of opportunity for significant decline in the financial markets.
4) This is followed by a potential rebound and "raging bull" market mid-decade, beginning in 2022/2023.
4) Weakness in the early 2030's.
Good Times Don't Last Forever
This bull market has been around for a long time. Stocks aren't cheap. But here's the thing -- for the last decade, stocks have generated annualized gains of just 8% per year. According to Michael Santoli at CNBC, past bull markets had annualized gains in the 15%+ range over same amount of time.
This doesn't feel so much like a bubble, so much as it does the most reluctant bull market ever. And that might be the key to its longevity.
Jim Lee, CFA, CMT, CFP®
Founder, StratFI